Posts

Showing posts from May, 2020

May 5: Italy's path back

Image
Italy was viewed for a while as an example NOT to follow... quite the contrary! Yes, I’m biased, as that’s my native country, but the facts of Italy’s behavior, both at the level of government and people, during this pandemic cannot be denied. This article explains very well what has been happening as Italy is starting its own (deliberately slow) path to opening up. As Italians move toward a less stringent regimen to minimize their exposure to the coronavirus, they can take pride in an unusual collective effort. nytimes.com Opinion | How Italy Coped, and Will Keep Coping As Italians move toward a less stringent regimen to minimize their… As Italians move toward a less stringent regimen to minimize their exposure to the coronavirus, they can take pride in an unusual collective effort.
May 2: How many deaths are realated to COVID-19?

Image
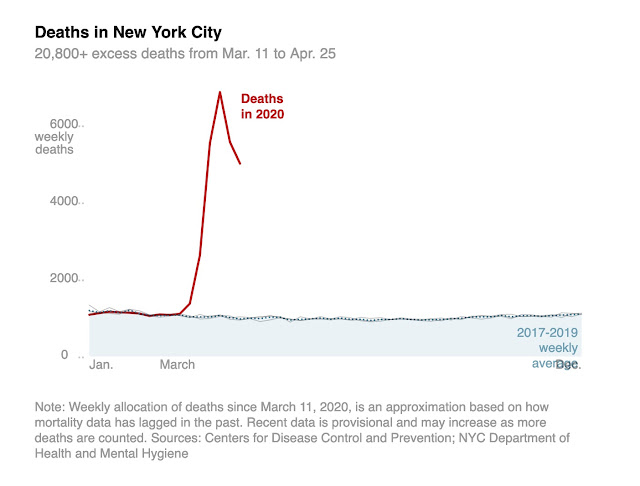
I continue to be baffled by the desire of so many to downplay the death toll of this virus. Why is this happening? I really hate to think that many are ready to trade-off life for economic recovery, as if this were really a dichotomy. I'm not the only one who thinks that economic recovery will start only when people will feel safe. People will not feel safe as long as they don't know who is contagious, and are assured that the medical system can take care of them, with adequ ate availability and, as soon as possible, effective therapies (while we wait for the vaccine). The upshot is that prioritizing safety by opening up slowly and making sure that we don't cause new waves, is ALSO the best path to recovery. Let me stress again that we DO have to start allowing people to get out of their houses to go back to work. Clearly we cannot stay home forever.... Even that does not make the virus "go away" . It's still out there waiting for us to come out

April 12: A "blue marble" moment

Image
I just finished watching Bocelli's gift perfomance at Milan's Duomo, and I'm still wiping tears off my eyes. This was loaded with emotion for me. My city of birth. A city where most of my beloved relatives still live. A cathedral I have often been in and always inspired by, in appreciation of every person's longing for something "larger" than themselves. And here is a man, blind, unable to see the emptiness of the square in front of him (see the tiny figure in front of the Duomo), but certainly able to feel it. A beaut iful voice, singing on behalf of humanity... to hope and unity. I was suddenly struck by how this felt to me like a new "blue marble" moment, when astronauts on the moon looked up and, for the first time, saw our beautiful Earth, our home, in the sky. If there is a silver lining to this pandemic it may well be a powerful and hopefully lasting reminder of our common humanity.

April 12: Reasoning fallacies

Image
 This is very good! But I don't want to be so arrogant as to say that even as scientist I have never fallen into any of these traps ... I can only say that I always try not to, and I welcome being called on it if I do!

April 6: Which "curve" are we talking about?

Image
I am not surprised that folks are confused about the apparent contradiction between "light at the end of the tunnel" and "the worst weeks are still to come", and even Dr. Fauci (with all due respect) did not do a good job explaining that... This goes together with them talking alternatively about "peaks" and about "flattening the curve". The explanation will be totally obvious to folks who have had calculus... but I will assume that that knowledge might be rusty for many at this point. What's been unclear (IMO) is that they have been talking about two different curves, and they have not bothered to explain that fact. The first curve (first picture) shows the daily number of deaths in the US. I have been showing the daily number of new cases. The shape is the same. So, what happens is that deaths (or new cases) keep increasing as the virus takes off. If measures are effective the daily number of new cases (and, later, deaths)

April 3: How many will die?

Image
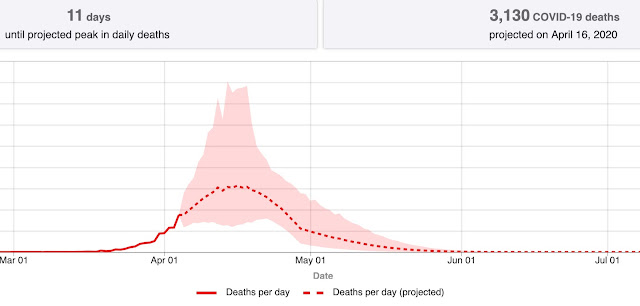
It's not clear to me whether the number of deaths predicted by the models shown at the WH briefings (100-240K) refer just to "first wave" (up to the "flattening") or to the entire course of the pandemic. I suspect it's just the former. The reason is that, even without modeling sophistication, unchecked epidemics end up affecting a large % of the population.Harvard epidemiologist Marc Lipsitch, estimates it’s “plausible” that 20 to 60 percent of adults will catch the disease w ithin a year (I have seen more dire estimates). Let's make it 40%, and that's 130M. a 1% death rate would cause 1.3 Million deaths. Social distancing doesn't "kill" the virus, it just prevents it from finding new hosts. Some authorities make it sound like with "flattening" we won the battle. The reality is that it will be the start of a long battle to slowly restart the economy and social "normalcy" while at the same time preventin

April 2: Wearing face masks

Image
It looks like even our "authorities" are coming around on the issue of wearing face masks. I feel proud of the fact that I questioned the original pronouncements from the very start. A post from March 15 (it already feels like months ago!) describes an interaction I had had with the chief medical officer at NASA Ames. You can go check it out. The upshot, was the following for me: The N-95 masks should go to medical workers and only to medical workers until we are sure that th ey have what they need. The reason is that these masks, if worn properly, are viewed as capable of preventing inhalation of the virus, so, for front line health workers, they can mean life and death... I don't know how supply chains work, and how my ordering one (even aside from the issue of reusability) from Amazon can interfere with a health worker getting one. I really don't know, and I'd love help in understanding this. All I can say is that I am personally uneasy wearing one

April 1: "Bubble Helmets" as alternatives to ventilators

Image
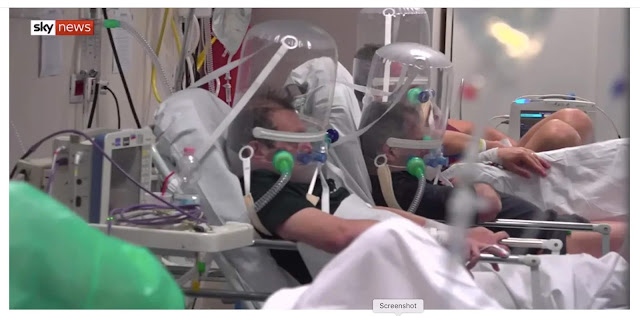
It's been good to see that daily briefings from the COVID-19 task force have begun to show graphs and some real data, including the graph of the Italian curve of "new cases" that I have been showing in the past. This curve shows that new cases have finally started to decrease and are expected to go down to 0 by end of April or mid-May. I will address what that means in a post to follow. Today I want to show another piece of news in the context of "learning from other countri es". One way Italians dealt with a severe shortage of ventilators has been with a new "bubble helmet", which is much cheaper, less invasive (no tubes down the trachea) and, according to a University of Chicago study published in the journal JAMA in 2016, it produces BETTER survival outcomes. These cost in the order of hundreds of dollars instead of several thousands. According to TV news a small Texas firm has been funded by Elon Musk to produce these. I have not been

March 30: Visualization of the effect of social distancing

Image
Here is a great visualization I ran across. The link also shows the drastic difference that early measures can make. On the "negative" side, this also shows how the virus does not "give up" so to speak. Which is why, even when the curve will be finally flat, extreme caution, planning, testing and containment strategies will still be needed... until we finally get a vaccine! https://www.visualcapitalist.com/the-math-behind-social-distancing/?fbclid=IwAR3xehZbIJxahnKrzZBaCaG7oFWQSdLYYkli5AjsARZhQHenvrzKrNSSPN4

March 26: The 1630 bubonic plague in Milan

Image
Milan, and the rest of Europe, experienced several previous epidemics that basically wiped out half of the population in the middle ages. I want to talk a bit about the last major "bubonic plague" that hit MIlan in 1629. It was a bacterial infection rather than viral, and at that time they had no idea of what caused either type, and no effective cures. They did understand that it was propagated from person to person and they enacted quarantines. They thought they had it lic ked by the following year ... and they couldn't resist the temptation to celebrate the "Carnevale" in March 1630. The plague came back, and then back again in 1631. In the absence of a vaccine, and other strong measures COVID-19 will probably return as well (that's also Fauci's opinion). We are lucky that COVID is much less deadly (the plague killed from 30 to 90% of infected). Milan lost about 60K out of a population of 130K. I first learned about the plague from re

March 24: On the other side of the curve

Image
More good news from Italy. The rate of increase of infections continues to go down. It's now 8.1% and finally on a decreasing trend down from the early days of staggering doubling times (see first graph). I am tempted to start deriving "lessons" for us... but I will refrain until this trend is confirmed w/o any doubt. All European countries have adopted "stay at home" and social distancing measures. Spain and Germany are pretty much tracking Italy's curve (showing so far th at there wasn't anything "special" about Italy...except that it started earlier there. France is doing a bit better, and the US much worse than everybody else. Look at how steep the US curve is and consider that it has 6 times the population of Italy. That means plenty of room to go... and very fast... thus with huge overwhelm of the medical system. A decision to stop social distancing measures at this point can only make the situation much worse (one doesn

March 23: good news and bad news

Image
Some tentative "good" news and some ... not so good. A few posts ago I showed a graph of a model of the daily new cases predicted in Italy. The graph shows new cases beginning to decrease on Mar 18. It was then revised to March 23. The model is shown again here with the actual data, that tracks it pretty well. If this holds up it means two important things: 1) they are finally on their way to "flattening the curve" (the graph needs to get down to 0, and 2) the assumptions ab out the main modes of spread of the virus are correct, and the "stay home" and closure measures (enacted about 3 weeks ago) are working. What's not so good? Look at the third graph. It shows the number of cases as they increased in different countries. South Korea (brown) was ready with testing and strong immediate containment measures. Italy (red graph) obviously screwed up somewhere (in spite of what I saw as quick strong measures... but that's another st

March 21: More on "flattening the curve"

I'd like to add a few points to my "what happens after we flatten the curve" post (I actually try to keep my posts reasonably short). Wuhan is already there and from Italian news I see that they are already slowly opening up the economy, but it's not yet clear to me what restrictions are still in place. One extremely important advantage of a return to 0 or very few cases is that "contact tracing" becomes possible again. That means that we can go back to quarantining a few i nfected and carriers as opposed to the entire population, which is essentially what's happening now. My understanding is that the Chinese have been very aggressive with that. We can certainly learn... and hopefully by the time we get to that point there will be enough tests around to be able to do the contact tracing we failed to do the first time around. A Chinese delegation is now in Italy "scolding" the Italian government for not being tough enough... The

March 20: After the curve is "flattened"

Image
So, what happens after we "flatten the curve" ? Before I try to venture an answer to that let me point out a few facts. We are not going to have "one curve" for the US. It's going to look like the current European situation (see picture), with different states starting the exponential growth at different times and with different results, depending on measures taken and how soon. This basically means that while a state reaches the peak another one will just start... and this w ill prolong the process. So let's just assume we have reached the "flat" stage. China has already done so (as they report) and Italy is expected to get there in month and half. Two very good things can be said: 1. We know how to stop the virus from spreading , 2. Our models of how it spreads are reasonably accurate. The value of #1 is obvious, but #2 can put to rest fears of modes of spreading that are not parts of the basic modeling assumptions (like long suspe

March 20: Light at the end of the tunnel?

Image
So far I've mostly tried to bring recognition and understanding for the severity of the problem we are facing. The reason is for us to be ready for, and accepting of, even the most drastic measures that will be taken. Today I'd like to speak to what the "light at the end of the tunnel" will look like ... assuming you'll want to think of it that way. I'm sure you have heard about the fact that the number of deaths in Italy has surpassed those of China. That's of course becaus e the number of cases continues to increase. What is less obvious, unless you look at appropriate graphs is that the daily rate of new cases (as % of the total) has been decreasing; and they are waiting (..and hoping) to start seeing the effect of the "national lockdown" enacted about a week ago. Look at the first graph. It shows the daily % of increase from the start. Note that it started around 25% and higher spikes... It is now down to around 15%. I's no

March 19: A probability game.

Contagion is a probability "game", and, unfortunately, just as is the case for exponential growth phenomena, people have a hard time wrapping their brains around probability effects. Each type of virus has its one favorite mode of transmission. That is the mode in which you are most likely to be affected. For instance Measles can easily stay airborne and each case typically infects 12 to 18 others if unchecked. The number is about six for polio, smallpox, and rubella, and, f ortunately, only two to three for COVID-19. The 2-3 number says something about how it is likely to be transmitted. Earlier this month, CDC reported that the rate of symptomatic infection among a patient’s household members was 10.5%. The rate among other close contacts was 0.45%. This is consistent with the "droplet spread" mode of transmission rather than the airborne transmission of Measles. Which, again, doesn't mean that there might not been some virus "in the air&qu

March 18: My purpose in posting

If it's not obvious, the reason I have been posting so much about the math of contagion, the Italian experience and the plight of front line medical workers, is to save lives. This may have been totally naive, but it gave me some agency. If even one person decided two weeks ago, to avoid a meeting, and, in so doing, avoided getting infected and spreading the virus to others... this will have been totally worth it! It was also "easy" to do. That math is what it is... and ther e was no reason to believe that the Italian experience would not be our own likely path. I felt a bit like an "oracle" ... with the "duty" to shout the impending doom from the mountain, so folks would take shelter, at my own risk of being lynched... which is often the destiny of messengers of bad news. We are now at a different stage. Our own numbers are beginning to do the talking. COVID-19 is no longer a "hoax". Authorities are beginning to take action. M

March 17: Death rates by age

Image
Here are the death rates so far in Italy by age (as of 3/13). I have no reason to believe that they will be any different here. Note that the Italian population is a bit older on average, but very healthy and able to avail itself of universal health care. One thing to note that I had not been aware of is that men's death rates are considerably higher than women's (60% to 40%), proving again that women are the "stronger sex"... Note also that as of 3/13 the health system was still managing to keep up. As it struggles more for beds, ICUs, respirators etc. I'm afraid that the death rate may get worse.

March 17: Reaching the "peak" - real data

Image
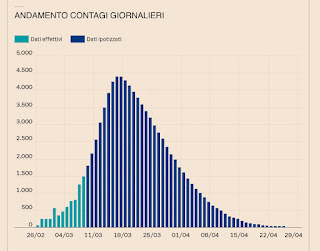
An update to my previous post. First of all the information comes from the reputable Italian newspaper "Il Sole 24-ore". They get their data from gov sources. I did not find an updated "model" but I did find the actual data, which shows the model to be reasonably accurate (same say peak on 3/23 instead of 3/18... but...). Note this is a peak of NEW DAILY CASES. This means that the number of infected will continue to increase until the end of the tail of the curve. At that poi nt we'll not be out of the woods. There will still be the very large number of infected cases, with many occupying hospital beds and ICUs now being prepped in exposition halls and wherever they find space. That number will slowly decrease as people recover or die. The good news is that we will know that the prevention measures (quarantines, distancing etc.) did work! Again, the effect of any measures shows up weeks later. If you find out that they did not work you lost weeks..

March 16: Reaching the "peak"

Here is a graph of the daily new number of coronavirus cases predicted in Italy. Note that the exponential growth continues for a few more days and finally peaks on March 18 (green is up to now - remember that the rest of the world goes day/month). This is very much like trying to predict where a hurricane will land. The difference (to pursue the analogy) is that what we do actually determines the path and strength of the hurricane! The "problem" with this is that if we m anage to lessen the impact of the virus, all measures taken will be viewed as having been "overreactions", when in fact they were what made the impact less severe. The "peak", if the prediction holds, will happen because of the draconian measures taken a week or so ago. Meanwhile infections and deaths will continue to rise. The expected result is a severely strained medical system. They are now putting beds everywhere they can find space, and basically scrambling to incre

March 16: exhausted health workers

Image
photos from a system (Italy) that is struggling to keep up: exhaustion and sore face from wearing a protective mask...

March 15: Face masks

In Asia and in Italy they have been using face masks. China made them compulsory. They stopped the virus - of course with much more severe measures than face masks, but they were part of the overall strategy. They are now donating millions of them to Italy to add to their supply (thank you, China!). Why are they not being recommended by the "authorities" here? Got tired of seeing the usual "cut and paste" explanations, and asked the following where I work (NASA Ames -- yes I am scientist there): 1. If they are recommended for health workers and close contacts why would they also not be good for more casual contact except possibly not to exhaust the supply for where they are needed most? (If so that should be mentioned). 2. It appears that folks can be asymptomatic for days and still spread the virus. That means that “I” (without symptoms) could be unknowingly be spreading the virus, and wearing a mask might be preventing that… My question and commen

March 13th: Health system overwhelm

You may have heard that in Northern Italy the medical system has reached the point where they have to choose which sick patients they will try to save and which they have to "let die". (I was just told by a cousin in Milan that this is in fact NOT happening yet --- but what follows is still relevant). Their system is state-of-the-arts but was still not ready for the onslaught of the virus. Still they are not taking this "lying down". Italy has more than doubled their intern al production of respirators, they have accelerated the graduation of medical students, are building new ICU units... and generally scrambling to deal with the emergency. Is anything happening here to get ready? Please call your congressman. It's not just about ramping up testing. We ramp up building weapons in wars. We can certainly built respirators and hospital gear... It would be good for the economy too!