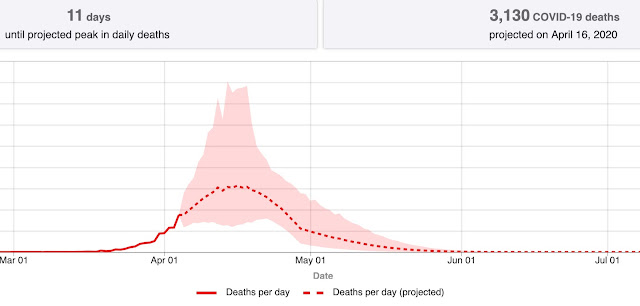
March 30: Visualization of the effect of social distancing
Here is a great visualization I ran across. The link also shows the
drastic difference that early measures can make. On the "negative" side,
this also shows how the virus does not "give up" so to speak. Which is
why, even when the curve will be finally flat, extreme caution,
planning, testing and containment strategies will still be needed...
until we finally get a vaccine!
https://www.visualcapitalist.com/the-math-behind-social-distancing/?fbclid=IwAR3xehZbIJxahnKrzZBaCaG7oFWQSdLYYkli5AjsARZhQHenvrzKrNSSPN4

https://www.visualcapitalist.com/the-math-behind-social-distancing/?fbclid=IwAR3xehZbIJxahnKrzZBaCaG7oFWQSdLYYkli5AjsARZhQHenvrzKrNSSPN4


Comments
Post a Comment