March 20: Light at the end of the tunnel?
So far I've mostly tried to bring recognition and understanding for the
severity of the problem we are facing. The reason is for us to be ready
for, and accepting of, even the most drastic measures that will be
taken. Today I'd like to speak to what the "light at the end of the
tunnel" will look like ... assuming you'll want to think of it that way.
I'm sure you have heard about the fact that the number of deaths in
Italy has surpassed those of China. That's of course because
the number of cases continues to increase. What is less obvious, unless
you look at appropriate graphs is that the daily rate of new cases (as %
of the total) has been decreasing; and they are waiting (..and hoping)
to start seeing the effect of the "national lockdown" enacted about a
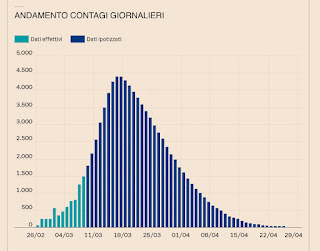
week ago. Look at the first graph. It shows the daily % of increase from
the start. Note that it started around 25% and higher spikes... It is
now down to around 15%. I's not low enough. It needs to get to 0% for
"no new cases". China got there a couple of days ago. An earlier model I
showed for Italy had them get to that point at the end of April. They
are now saying mid-May. They have been about 2 months behind China.
What will the situation look like after that? Look at the second graph.
It shows the total number of cases in Italy (red - still growing) with
those of the Chinese province of Hubei (yellow) that has 60 Million
people - about the same as Italy -. Note the large number of cases
remaining. Among those many will continue be very sick and dying. many
will recover. Can we start easing "stay at home" measures at that point?
Good question. I'll try to address that later. Meanwhile we are about 3
weeks behind Italy here with about 6 times the population. You can do
the math.


Comments
Post a Comment